The real value of money
What is your money really worth?
TEYMUR measures every currency against the world's money — not against one counterpart. Built from central-bank reference rates, weighted by GDP, computed on every official day since 2005 and never revised. One number per currency per day, in TYMR (sign ): the question "did the dollar fall, or did the yuan rise?" gets one neutral answer.
See today's values How it works
1 USD = 1.3032 TYMR on Official · live 1.3038 Live · USDTYMR page

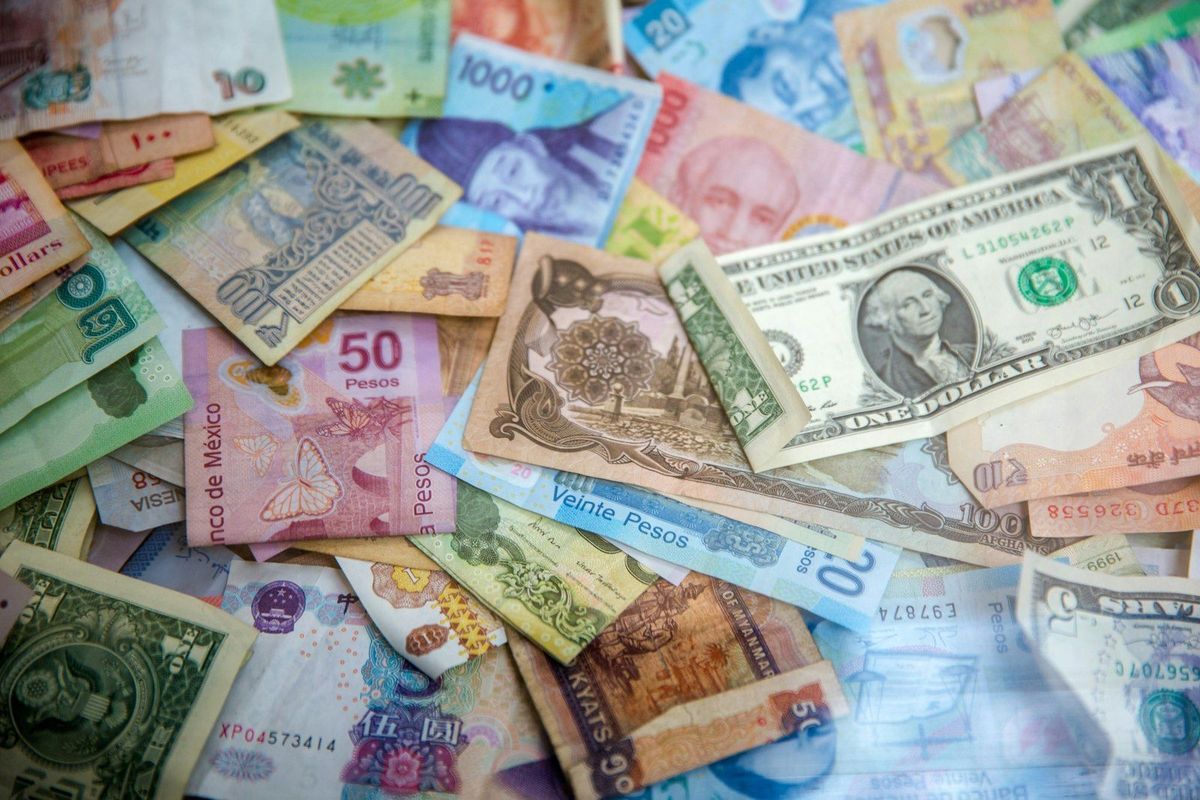
Collect
29 currencies, each priced once a day from its central-bank reference rate — the ECB for most, national sources for the rest.

Weigh
Each currency counts by its economy's share of world GDP (IMF World Economic Outlook, point-in-time vintages). No single currency is the yardstick.

Publish
One value per currency per official day, in TYMR, since 3 January 2005 — published once and never recomputed.
Why TEYMUR
Neutral
No currency is the unit of measure. Each one is priced against the GDP-weighted mass of all member currencies, so a move has one reading, not two.
Transparent
A written method, public inputs and a published weight for every member. Any official day can be recomputed from its inputs and checked line by line.
Permanent
Official values are first-print-final: never recomputed after publication, with daily snapshots anchored in a manifest hash chain.
From the data
Over the past year (since 9 October 2025), the US dollar gained 0.11% of its value; the Chinese yuan gained 6.55% of its value against world money. USD page · CNY page · all currencies
Today's official values
Official value per one unit of each currency in TYMR on , period changes, current weight and the live indicator. Click a heading to sort; click a row for the currency's page. Published · method v1.0.
| Currency | Official ( per unit) | 1d | 1w | 1m | YTD | 1y | Weight | Live |
|---|---|---|---|---|---|---|---|---|
| AEDAEDTYMR UAE dirham | 0.3549 | -0.09% | -0.12% | +1.40% | +0.54% | +0.11% | 0.56% | 0.3550 |
| AUDAUDTYMR Australian dollar | 0.9098 | +0.45% | +0.48% | -2.02% | +5.01% | +5.94% | 1.82% | 0.9108 |
| BRLBRLTYMR Brazilian real | 0.2604 | +0.14% | +4.20% | +3.10% | +10.03% | +6.59% | 2.21% | 0.2613 |
| CADCADTYMR Canadian dollar | 0.9160 | +0.16% | -0.03% | -1.86% | -3.24% | -1.83% | 2.28% | 0.9146 |
| CHFCHFTYMR Swiss franc | 1.5681 | +0.23% | -0.65% | -1.53% | -4.11% | -3.42% | 0.95% | 1.5704 |
| CNYCNYTYMR Chinese yuan | 0.1947 | +0.06% | +0.06% | +1.64% | +5.18% | +6.55% | 19.04% | 0.1947 |
| CZKCZKTYMR Czech koruna | 0.0599 | +0.23% | +0.12% | -2.97% | -4.64% | -3.55% | — | 0.0599 |
| DKKDKKTYMR Danish krone | 0.1954 | +0.07% | -0.31% | -2.48% | -4.20% | -3.49% | 0.43% | 0.1954 |
| EUREURTYMR Euro | 1.4604 | +0.09% | -0.29% | -2.48% | -4.12% | -3.38% | 16.70% | 1.4605 |
| GBPGBPTYMR Pound sterling | 1.7229 | +0.01% | +0.03% | -1.17% | -1.29% | -1.03% | 3.70% | 1.7253 |
| HKDHKDTYMR Hong Kong dollar | 0.1661 | -0.09% | -0.13% | +1.33% | -0.28% | -0.75% | 0.41% | 0.1661 |
| HUFHUFTYMR Hungarian forint | 0.004000 | +0.41% | +0.83% | -2.78% | +1.15% | +3.47% | — | 0.004002 |
| IDRIDRTYMR Indonesian rupiah | 0.00007288 | +0.13% | +0.27% | -0.89% | -6.01% | -7.28% | 1.42% | 0.00007284 |
| ILSILSTYMR Israeli shekel | 0.4263 | +0.56% | +0.14% | +0.14% | +4.87% | +6.27% | 0.55% | 0.4257 |
| INRINRTYMR Indian rupee | 0.0135 | -0.04% | -0.54% | -0.30% | -6.60% | -8.10% | 3.97% | 0.0135 |
| ISKISKTYMR Icelandic krona | 0.0107 | +0.23% | -0.14% | +0.09% | +3.17% | +0.15% | — | 0.0107 |
| JPYJPYTYMR Japanese yen | 0.008235 | -0.08% | -0.49% | -1.79% | -0.47% | -3.35% | 4.08% | 0.008236 |
| KRWKRWTYMR Korean won | 0.0009715 | +0.05% | +0.38% | +1.00% | +8.23% | +5.91% | 1.90% | 0.0009728 |
| MXNMXNTYMR Mexican peso | 0.0716 | -1.12% | +0.62% | -5.83% | -0.72% | +0.76% | 1.88% | 0.0708 |
| MYRMYRTYMR Malaysian ringgit | 0.3190 | +0.07% | -0.13% | +1.03% | -0.13% | +3.32% | 0.43% | 0.3189 |
| NOKNOKTYMR Norwegian krone | 0.1363 | +0.10% | +0.79% | -2.64% | +5.97% | +4.81% | 0.49% | 0.1364 |
| NZDNZDTYMR New Zealand dollar | 0.7316 | +0.35% | -0.09% | -2.76% | -2.11% | -2.72% | — | 0.7318 |
| PHPPHPTYMR Philippine peso | 0.0207 | +0.20% | -0.48% | +0.87% | -5.66% | -7.28% | 0.47% | 0.0208 |
| PLNPLNTYMR Polish zloty | 0.3332 | -0.10% | -0.43% | -4.00% | -7.67% | -6.22% | 0.93% | 0.3317 |
| RONRONTYMR Romanian leu | 0.2734 | +0.14% | -0.14% | -4.05% | -8.50% | -7.83% | — | 0.2733 |
| SARSARTYMR Saudi riyal | 0.3475 | -0.09% | -0.12% | +1.40% | +0.54% | +0.11% | 1.26% | 0.3477 |
| SEKSEKTYMR Swedish krona | 0.1308 | +0.32% | +0.80% | -2.64% | -7.09% | -4.94% | 0.61% | 0.1304 |
| SGDSGDTYMR Singapore dollar | 1.0178 | +0.03% | -0.17% | +0.06% | +0.94% | +1.33% | 0.56% | 1.0181 |
| THBTHBTYMR Thai baht | 0.0389 | +0.37% | +0.07% | -0.58% | -5.03% | -2.76% | 0.53% | 0.0389 |
| TRYTRYTYMR Turkish lira | 0.0265 | -0.01% | -0.18% | -0.03% | -12.16% | -15.05% | 1.38% | 0.0264 |
| TWDTWDTYMR New Taiwan dollar | 0.0409 | -0.09% | -0.26% | +0.22% | -0.84% | -4.07% | 0.81% | 0.0408 |
| USDUSDTYMR US dollar | 1.3032 | -0.09% | -0.12% | +1.40% | +0.54% | +0.11% | 29.75% | 1.3038 |
| VNDVNDTYMR Vietnamese dong | 0.00005085 | -0.07% | -0.09% | +1.26% | -1.46% | -1.84% | 0.47% | 0.00005052 |
| ZARZARTYMR South African rand | 0.0788 | +0.62% | +1.09% | -1.62% | +0.63% | +3.56% | 0.41% | 0.0790 |
| BTCBTCTYMR Bitcoin | — | — | — | — | — | — | — | 107,818.1948 Live only |
| COPCOPTYMR Colombian peso | — | — | — | — | — | — | — | 0.0004083 Live only |
| EGPEGPTYMR Egyptian pound | — | — | — | — | — | — | — | 0.0249 Live only |
| XAGXAGTYMR Silver (troy ounce) | — | — | — | — | — | — | — | 79.3127 Live only |
| XAUXAUTYMR Gold (troy ounce) | — | — | — | — | — | — | — | 5,470.5995 Live only |
Notes
- Official values are computed once per TARGET business day from central-bank reference rates, weighted by nominal GDP (IMF WEO, point-in-time vintages), and are never recomputed once published.
- Live is a 10-minute indicator from market rates under the last official regime; it may differ from Official by a few basis points and is not a substitute for it.
- Period changes compare the official value with the last official value on or before the reference date. The weighting rule, membership history and documented data windows are on the all currencies page; the full recipe is in the methodology. Any past day: day lookup.
Methodology · Disclaimer — informational only, not investment advice.